1 Hospital Italiano La Plata 2 Hospital Italiano Rosario
Corresponding author’s address
Dr. Juan Erriest
Postal address: Calle 48 número 674 Piso 5 Dpto. A, 1990 La Plata, Provincia de Buenos Aires
E-mail
Received on November 17, 2021 Accepted after review on March 18, 2022 www.revistafac.org.ar
There are no conflicts of interest to disclose.
Keywords:
Myocardial perfusion.
Gated SPECT.
Phase analysis
Coronary artery disease
Left ventricle dyssynchrony
ABSTRACT
Imaging methods to assess left ventricular synchrony were developed with the aim of assessing dyssynchrony in order to resynchronize patients with heart failure, improve functional capacity and prognosis. Nuclear medicine developed phase analysis, an automated, reproducible technique that presents low inter- and intra-observer variability and allows to locate in a three-dimensional way where the left ventricular contraction begins and ends. The objective of this review is to learn the principles of the acquisition, processing and basic concepts of how of phase analysis software works for a correct interpretation of the left ventricular synchrony images.
INTRODUCTION
Since the 1990s, the development of hardware, software and technology made SPECT imaging and ECG-synchronized imaging possible. To a customary use of Thallium201 (TI201), new radiotracers were added, such as 99mTc MIBI (methoxy isobutyl isonitrile), improving the sensitivity, specificity and diagnostic accuracy of myocardial perfusion imaging (MPI). Currently, MPI is one of the most widely used diagnostic tests for the detection of ischemia and the clinical follow-up of chronic CAD[1].
Ventricular synchronicity is determined by the depolarization wave through the His-Purkinje system, mechanical activation and excitation-contraction coupling. In a normal heart, electrical activation duration and mechanical activation duration are closely related; in spite of this, there is a 20-30 ms delay in the excitation-contraction process[2]. In a structurally healthy heart, with no conduction disorders, mechanical activation spreads evenly, starting by the basal septum and the right ventricle, which activates slightly before the left ventricle (LV), so the sequence of activation ends in the lateral side of the LV. Once a segment is activated, it becomes thicker and then shortens, that is to say, thickening and contraction are closely related[3].
In heart disease, it is clear that asynchronous activation, both atrioventricular, intra and interventricular, has noticeable adverse consequences on ventricular pump function that lead to prolonged contraction, reduced ejection time, delayed and prolonged relaxation, reduced diastolic filling time and mitral regurgitation[4]. The general result is LV remodeling with growing volumes of the ventricular chamber and shape modifications[5]. Most of these harmful effects may improve by cardiac resynchronization therapy (CRT), and in fact, the clinical usefulness of CRT shows the importance of asynchrony in heart failure pathophysiology[6]. In spite of this, approximately 20-30% of patients do not respond as expected to CRT, because mechanical asynchrony is not necessarily related to electrical asynchrony, a fact that would account for non-responsive cases[7]. This has generated for other auxiliary methods that evaluate LV asynchrony, among them echocardiography, magnetic resonance imaging and nuclear medicine, to become more significant in the evaluation and decision-making in this group of patients[8].
Echocardiography has proven that LV asynchrony is a significant predictor of responsiveness to CRT[9]. Tissue Doppler imaging (TDI) enables the evaluation of segmental myocardial contraction and relaxation velocities and a comparison of the time of these different segmental velocities, and enables the evaluation LV asynchrony[5,9,10,11]. The PROSPECT (Predictors of Response to Cardiac Resynchronization Therapy) trial suggests that there is a need for a better standardization and improvement of echocardiographic detection tools that were used for the evaluation of LV asynchrony[12]. However, currently strain rate imaging allows to clinically predict the response to CRT[13].
Cardiac magnetic resonance (CMR) has been suggested for the analysis of LV asynchrony; particularly, using tagging to evaluate regional contractility and strain method through the analysis performed by feature-tracking (FT-CMR), which allows the quantification of motility and deformation by classical tagging from the tracing of endocardial and epicardial edges. CMR is also capable of measuring myocardial wall motion. Potentially, it enables directly measuring myocardial wall motion similarly to TDI (that is to say, comparing graphs of velocity obtained in different areas of the myocardial wall during systole)[14].
Nuclear imaging, just as radionuclide ventriculography, was used in the 1970s and 1980s to quantify interventricular and intraventricular asynchrony, based on Fourier phase analysis. Its usefulness to detect contractility anomalies enabled a collaboration to achieve the optimal placement of pacemaker ventricular lead[15]. However, the limitations inherent to planar imaging techniques brought forth the development of new tomographic imaging techniques.
Currently, there is software that allows to analyze ventricular synchrony through phase analysis, using the first harmonic of Fourier series, drawing information from gated MPI SPECT, using 99mTc sestamibi as tracer[16,17,18].
Previous studies have shown that the indices provided by phase analysis (bandwidth and standard deviation) of EPM SPECT are correlated to the asynchrony parameters assessed through tissue Doppler imaging[19,20].
LEFT VENTRICULAR SYNCHRONY IMAGING TESTS TECHNIQUES
The secret to obtain a good LV synchrony test is acquiring a SPECT test synchronized with high quality ECG.
Basic principles to acquire quality gated SPECT images.
Phase analysis software
BASIC CONCEPTS OF PHASE ANALYSIS
The assessment by phase analysis (PA) using the software developed by the Emory University, commercially known as Emory Cardiac Toolbox (SyncTool, Emory University, Atlanta, GA) has been described widely by Chen et al[16]. As expressed previously, image acquisition is required with gamma camera SPECT, perfusion tests obtained synchronically with electrocardiogram, to generate information about LV synchrony.
The main foundation of the PA used by the software to evaluate ventricular synchrony is based on knowing the time of onset of myocardial contraction, evaluating thickening and return to parietal rest thickness that occur during the cardiac cycle in the different LV segments. Thus, the software enables defining how homogeneous the contraction is, and it may determine where it starts and where it ends. Although ventricular electrical and mechanical activation are closely related, there is a 20-30 ms delay between excitation and finally, myocardial fibers contraction[2]. Once a cardiac segment is activated, it thickens and then contracts.
The limited spatial resolution of EPM SPECT does not allow to accurately measure LV wall thickening using geometric models. However, it has been shown that myocardial wall thickening changes are linear to change in the maximum number of counts drawn from a myocardial region, even in hypoperfused regions, making it possible to measure LV wall thickening[23,24]. This statement is based on the partial volume effect, a phenomenon based on a physical principle that establishes that there is a linear proportion between the change in the maximum number of counts and the change in myocardial wall thickening, taking into account that the myocardial wall (normal thickness 8 mm) has a linear dimension less than twice the spatial resolution of a system of images (SPECT images have a spatial resolution of 6-7 mm); the reduction in the number of maximum counts will be proportional to myocardial wall thickness decrease, and in an opposite way, the increase in the number of counts will be associated to an increase in myocardial wall thickness. Thus, this relationship, in terms of increase and decrease in the number of counts in relation to myocardial wall thickening, remains throughout the cardiac cycle (Figure 1).
The software reconstructs gated SPECT images (acquired in eight frames per cardiac cycle), analyzes the eight series of short axes in eight matrices of interpolated pixels, constituted by approximately 600 pixels, that represent all the LV sides and segments in systole and diastole, in a way that the necessary information is available to construct activity curves (number of counts)/time of each pixel of the matrix, using the eight series of acquired images during the cardiac cycle, information that allows visualizing in a graph of abscissas and ordinates (time within the R-R interval) the number of counts of a single pixel in eight different points over time during the cardiac cycle; then, it is possible to interpret when each of the pixels of the matrix constituted by the LV segments and walls thickens (phase), and it contracts. Likewise, it is possible to interpret when every pixel thickens (width) in terms of the change in count number during the cardiac cycle (Figure 2)[25].
It emerges from curve analysis to question the low temporal resolution of the system. In a patient presenting a 60 bpm heart rate, the temporal resolution will be equal to 1/8. It will be estimated by obtaining the quotient between R-R interval and the number of frames acquired; i.e. 1000 ms/8 frames; therefore, temporal resolution will be 125 ms.
To improve the temporal resolution of the software system uses Fourier analysis, which is based on the theorem called by the name of its author, Jean Baptiste Joseph Fourier (1768-1830), which establishes that: any physical function that varies periodically over time with a given frequency could be represented as the sum of the sine and cosine of the waves of different frequencies[26]. In quantitative terms, Fourier’s theorem may be formulated as a periodical function F of time t, with frequency of f, and could be expressed in the following manner: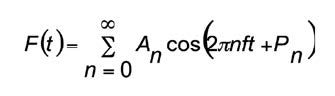
Each term in the previous summary is called harmonic. For instance, the term A0 is called zero harmonic; the term A1 cos (2πft + P1) is called first harmonic, and the term A2 cos (4πft + P2) is called second harmonic, and so on. For every harmonic, A is its width and P its phase. If the Fourier analysis is applied to a discrete function, the number of harmonics that could be obtained properly is limited by the number of samples within a period.
Fourier’s theorem could be expressed in the following manner: “any physical function that varies periodically over time with a given frequency could be represented as the sum of the sine and cosine of the waves of different frequencies”. The periodical nature of LV contraction and relaxation seems to be ideal for using Fourier analysis, as proposed first by Adam et al [23]. Fourier analysis allows to estimate amplitude and phase in terms of the changes in values in the number of counts for each pixel during the cardiac cycle in an imaging test, with a better temporal resolution. Amplitude information is related to the degree of parietal thickening, and phase information is related to the time in the cardiac cycle when parietal thickening starts..
Using the first harmonic of Fourier for phase analysis enables to draw the phase of each pixel of the short axes image matrices obtained during the cardiac cycle; i.e. the time of cardiac contraction onset of each pixel. The fact that activity/time curves are transformed in the distribution of eight discrete points joined by a line in continuous function improves the temporal resolution of the system to measure the phase. It has been demonstrated by Chen et al, that using the Fourier transform function decreases the temporal resolution of the 1/8 to 1/64 system of the cardiac cycle; i.e. from 125 ms to 16 ms in a patient with heart rate of 60 bpm, in a gated SPECT image system, regardless of images in 8 or 16 frames per cycle being acquired [27].
The way to show these data, obtained from the curves of time activity of each pixel, in a graph are phase histogram and phase polar map.
Phase histogram consists of creating a Cartesian coordinate graph. In the abscissa, there will be the time of cardiac cycle contraction onset or phase value of each pixel, expressed in degrees, from 0 to 360 degrees comprised in an R-R interval, where 0 degrees indicates the onset of the cycle and 360 degrees its end; in the ordinates there will be the frequency of distribution of phases expressed in percentage, equivalent to the number of pixels with the same phase. The greater the phase value, the greater the contraction delay. The color scale used in the histogram reflects the different phase values and it corresponds to the location of the pixels that present the same phase value. The form to locate the LV segment or region to which each corresponds is by verifying the location in the phase polar map, created on the LV 17-segment model (Figure 3).
The following are the quantitative indices used for synchrony analysis obtained from phase histogram (Figure 4):
Phase polar map
The phase polar map allows identifying the 17 LV segments. In it, the phase of each LV pixel is shown in a graph, using the color scale to represent the range of phases, in such a way that guided by the different colors it is possible to interpret in the polar map which are the regions where contraction starts, the regions where the trajectory continues and where the LV contraction ends along the cardiac cycle. Thus, the histogram provides the activation sequence and the polar map allows giving a location to this sequence.
The program developed by the Emory University uses dynamic screens to visualize the onset, trajectory and the end of myocardial contraction (Figure 5). The screens allow visualizing continuously the propagation wave of the cardiac contraction allowing to appreciate how synchronic the contraction is, where it starts and where it ends. The screens are added to a user interface as a tool for the evaluation of cardiac mechanical asynchrony.
The variables analyzed in phase histogram, BW, SD and K represent the degree of synchrony of the contraction. The reference values for a population of normal patients have been published by Chen et al (using the Emory software) (Table 1)[16].
CLINICAL IMPLICATIONS
BIBLIOGRAPHY